Streaming Render Service Logs
Forward logs to your third-party logging provider.
You can stream logs from your Render services and datastores to third-party logging providers via syslog (TLS) or HTTPS. The protocol you use depends on your logging provider.
After you set a default stream destination for your workspace, all of your supported services start streaming their logs to that destination. You can override this for individual services.
Render does not emit logs for static sites. Log stream support is not yet available for workflows (beta).
Setup
-
From your workspace home in the Render Dashboard, click Integrations > Observability in the left pane.
-
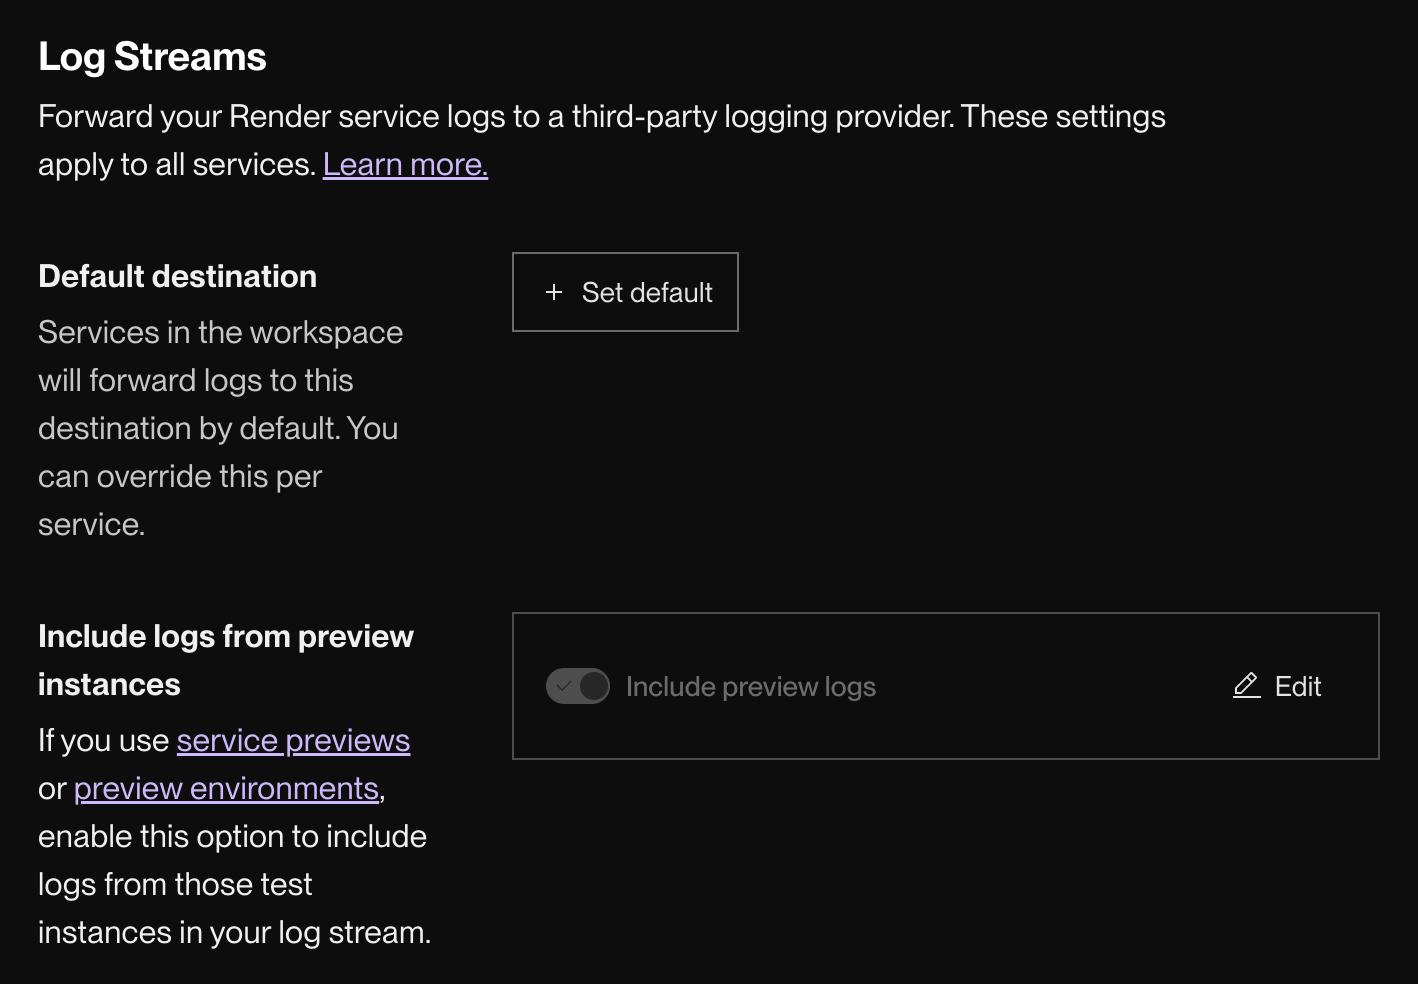
Scroll down to the Log Streams section:
-
Under Default destination, click + Set default.
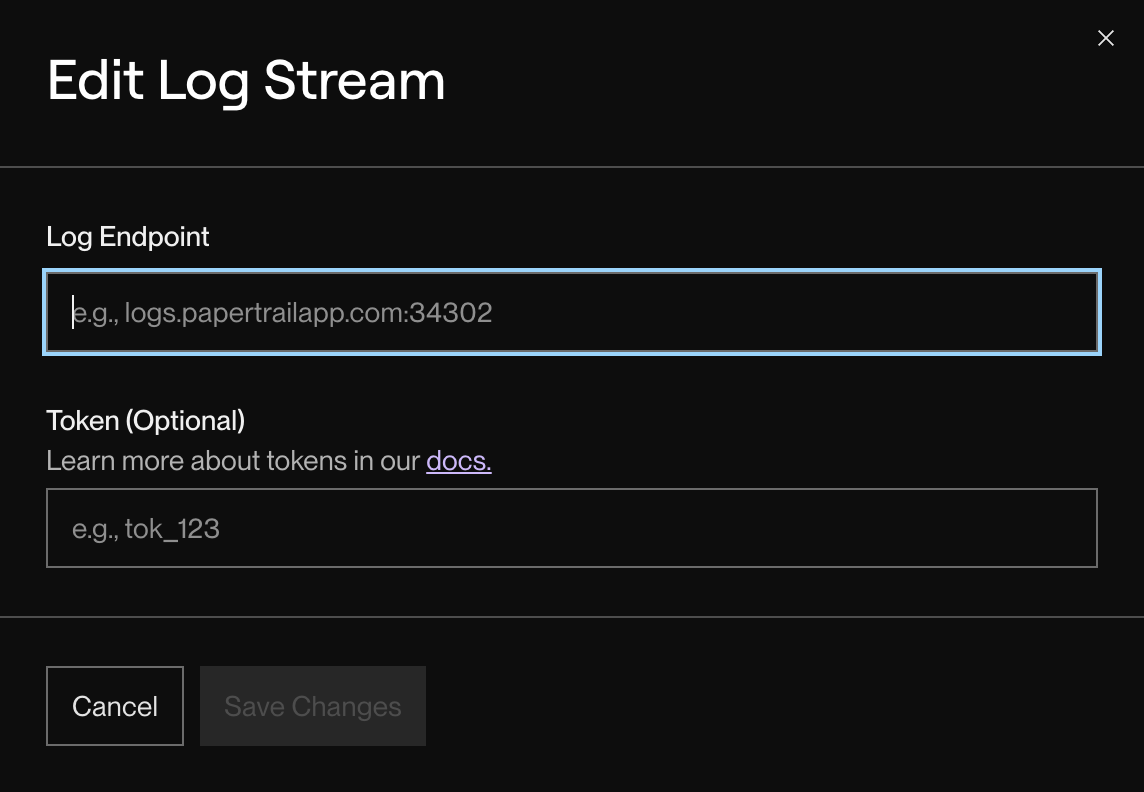
The following dialog appears:
-
Provide your logging provider's endpoint in the Log Endpoint field.
The format depends on your provider's endpoint type:
- Syslog: Use the format
HOST:PORT(for example,logs.papertrailapp.com:34302) - HTTPS: Use the full URL (for example,
https://http-intake.logs.datadoghq.com/api/v2/logs)
For help finding the endpoint for common providers, see below.
- Syslog: Use the format
-
If your provider requires an authentication token or API key, provide it in the Token field.
-
Click Save Changes.
-
Toggle Include logs from preview instances to configure whether your log stream includes logs from your service previews and preview environments.


You're all set! Logs from Render will start to appear in your provider's feed shortly.
Overriding defaults
Pro workspaces and higher can override log stream settings for individual services:
| Custom Setting | Hobby | Pro | Scale / Enterprise |
|---|---|---|---|
| Omit individual services from log stream | ❌ | 🟢 | 🟢 |
| Set a custom destination for individual services | ❌ | ❌ | 🟢 |
-
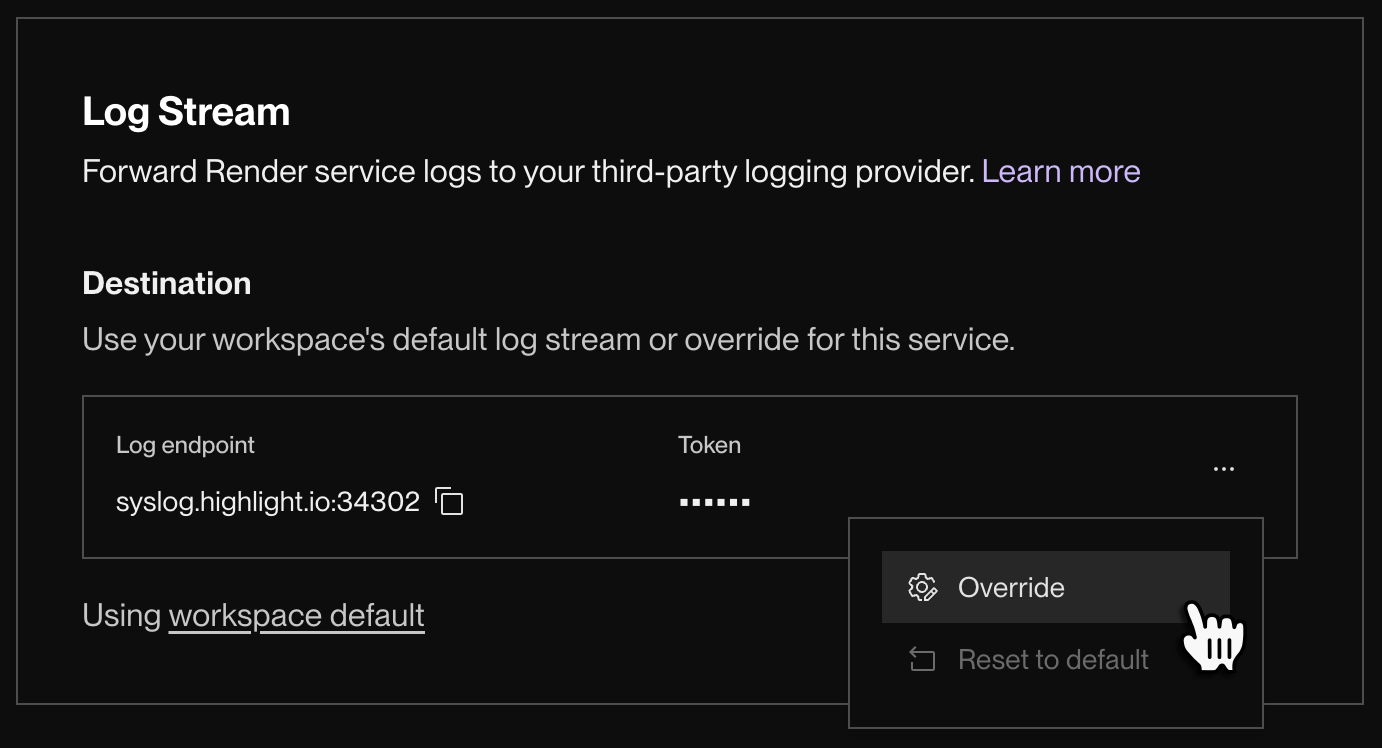
In the Render Dashboard, open the Settings page for the service you want to override and scroll down to the Log Stream section:
-
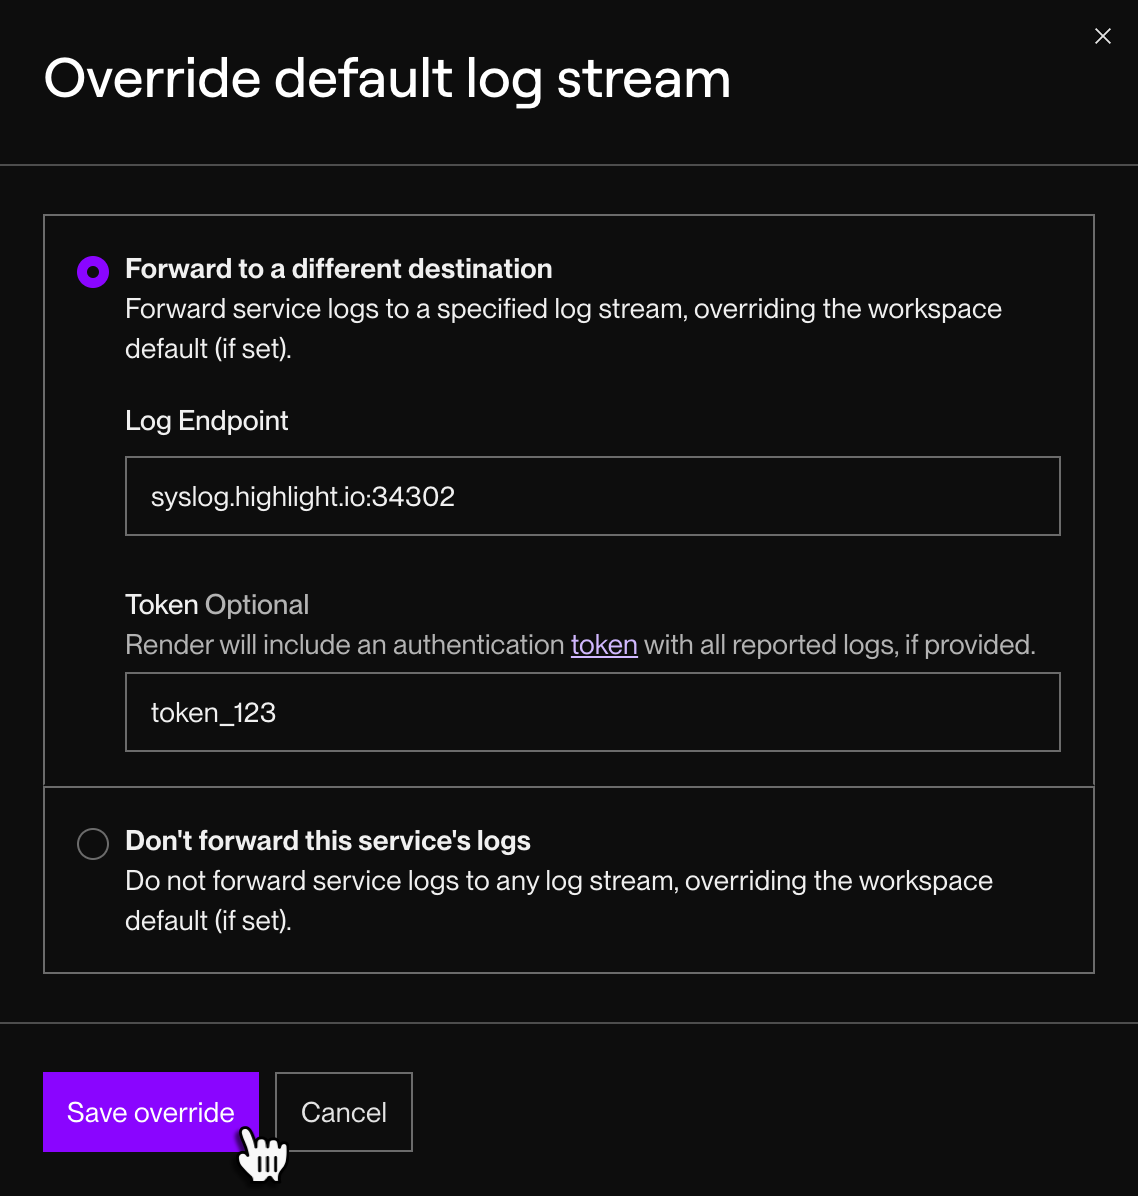
Open the ••• menu and click Override. The following dialog appears:
-
Select Forward to a different destination or Don't forward this service's logs.
- Forwarding to a different destination requires a Scale workspace or higher.
-
Provide any necessary details for the selected option and click Save override.


You're all set! Your service now uses its own custom log stream settings:

You can revert this custom configuration by clicking Reset to default.
Reporting format
Render delivers logs in different formats depending on the endpoint type.
Syslog endpoints
For syslog endpoints, Render streams logs over TLS-encrypted TCP. Log lines are formatted according to RFC5424, which is supported by most popular syslog providers.
If you encounter issues integrating with a syslog-compatible provider, please let us know at support@render.com.
A formatted log line looks like this:
Render annotates each log line with:
- The corresponding service's slug
- The type of service (
web,cron, etc.) - A unique identifier for the instance
- Use this value to track your service between deploys, or to distinguish between multiple instances if you're running more than one.
If you're using a standard format like logfmt or json, Render maps the level field to an appropriate syslog priority. Otherwise, Render makes a best effort to parse log levels, defaulting to INFO.
HTTPS endpoints
Render streams encrypted logs over HTTPS as JSON payloads. These JSON payloads have provider-specific schemas, including service metadata and log levels.
If an endpoint doesn't match a supported HTTPS provider, Render treats it as a syslog destination.
Finding your endpoint
Render supports streaming logs to providers that have a TLS-enabled syslog endpoint. Consult your provider's documentation for your endpoint and token, or refer to the instructions for common providers below.
HTTPS streaming is only available for the specified providers in the table below:
| Provider | Endpoint Type |
|---|---|
|
HTTPS | |
|
HTTPS | |
|
Syslog | |
|
Syslog | |
|
Syslog | |
|
Syslog | |
|
Syslog | |
|
Syslog | |
|
Syslog |
Want support for another HTTPS logging provider?
Please submit a feature request with the provider you'd like to see supported.
Better Stack
-
From the Telemetry section of your Better Stack dashboard, click Sources in the left sidebar.
-
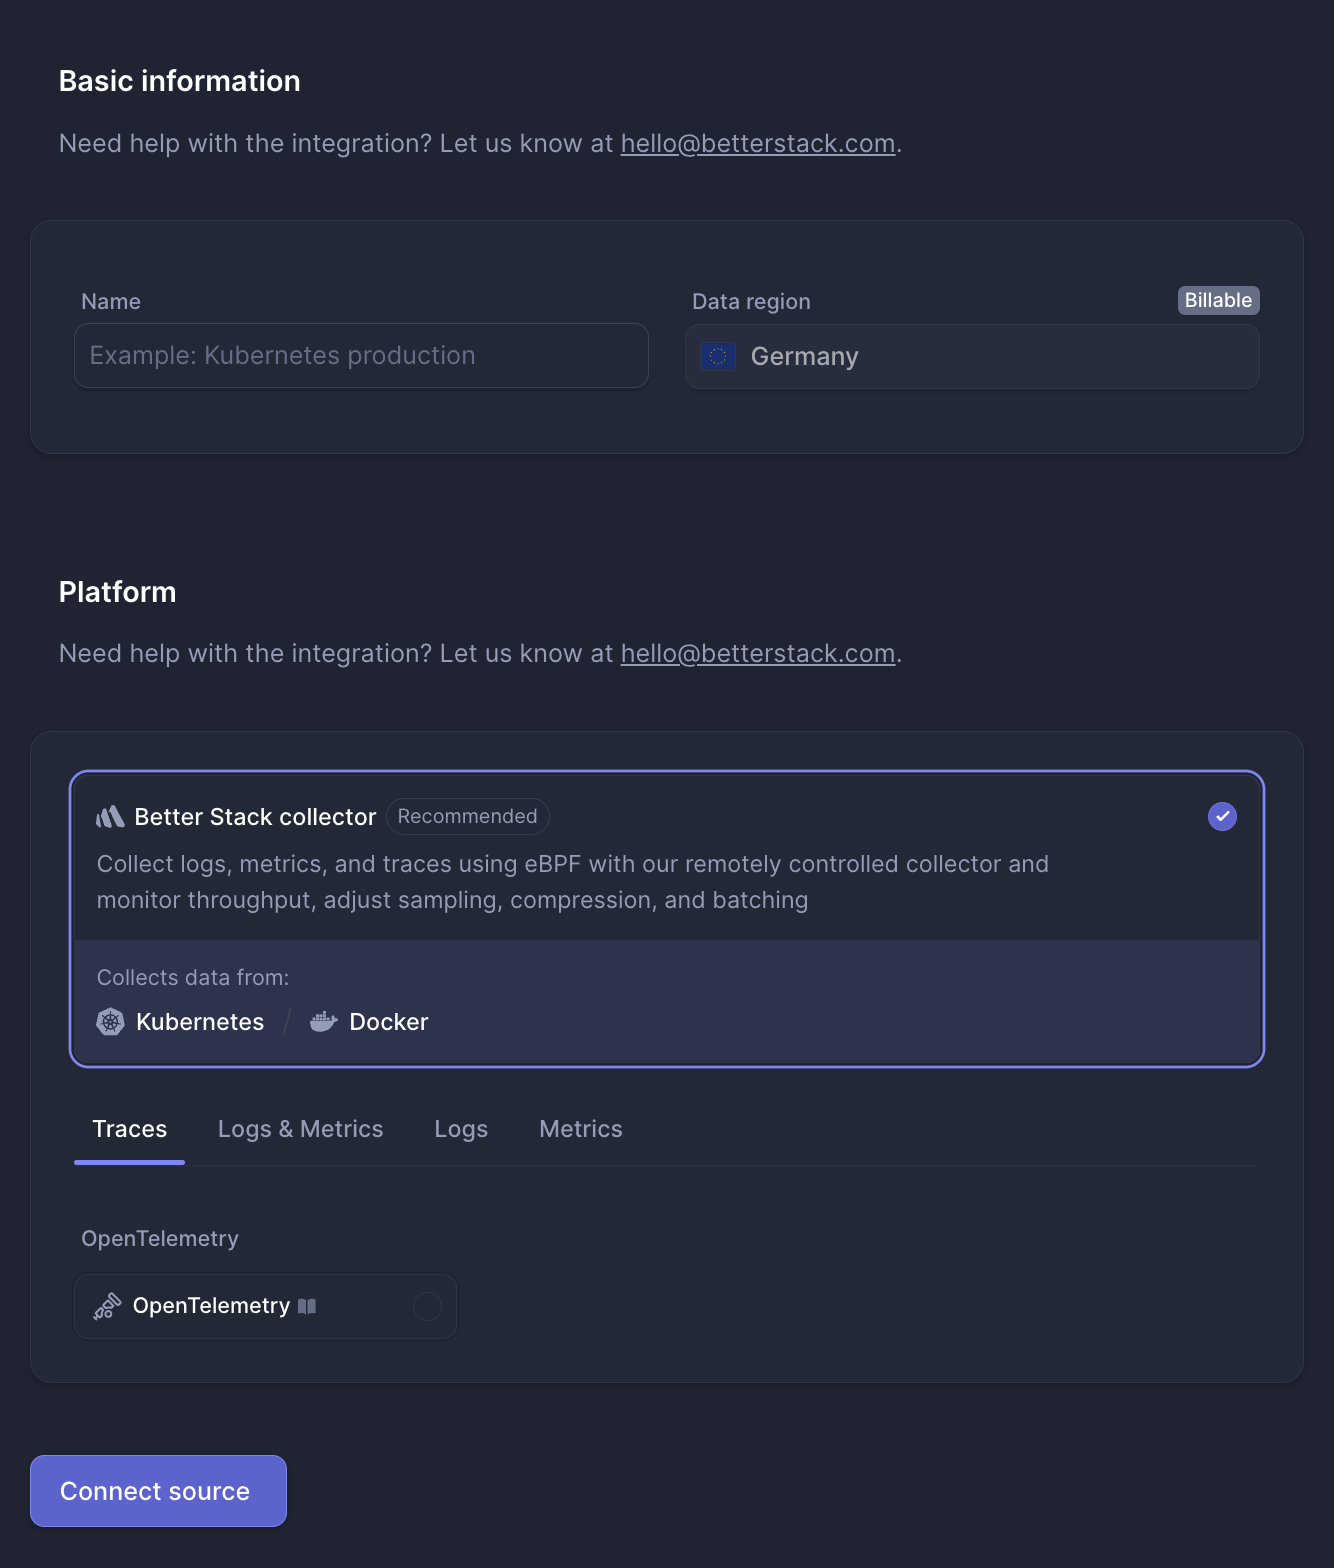
Click Connect source. The following form appears:
-
Give your source a descriptive Name (e.g., "Render log stream").
-
Under Platform, switch to the Logs tab and select Render.
-
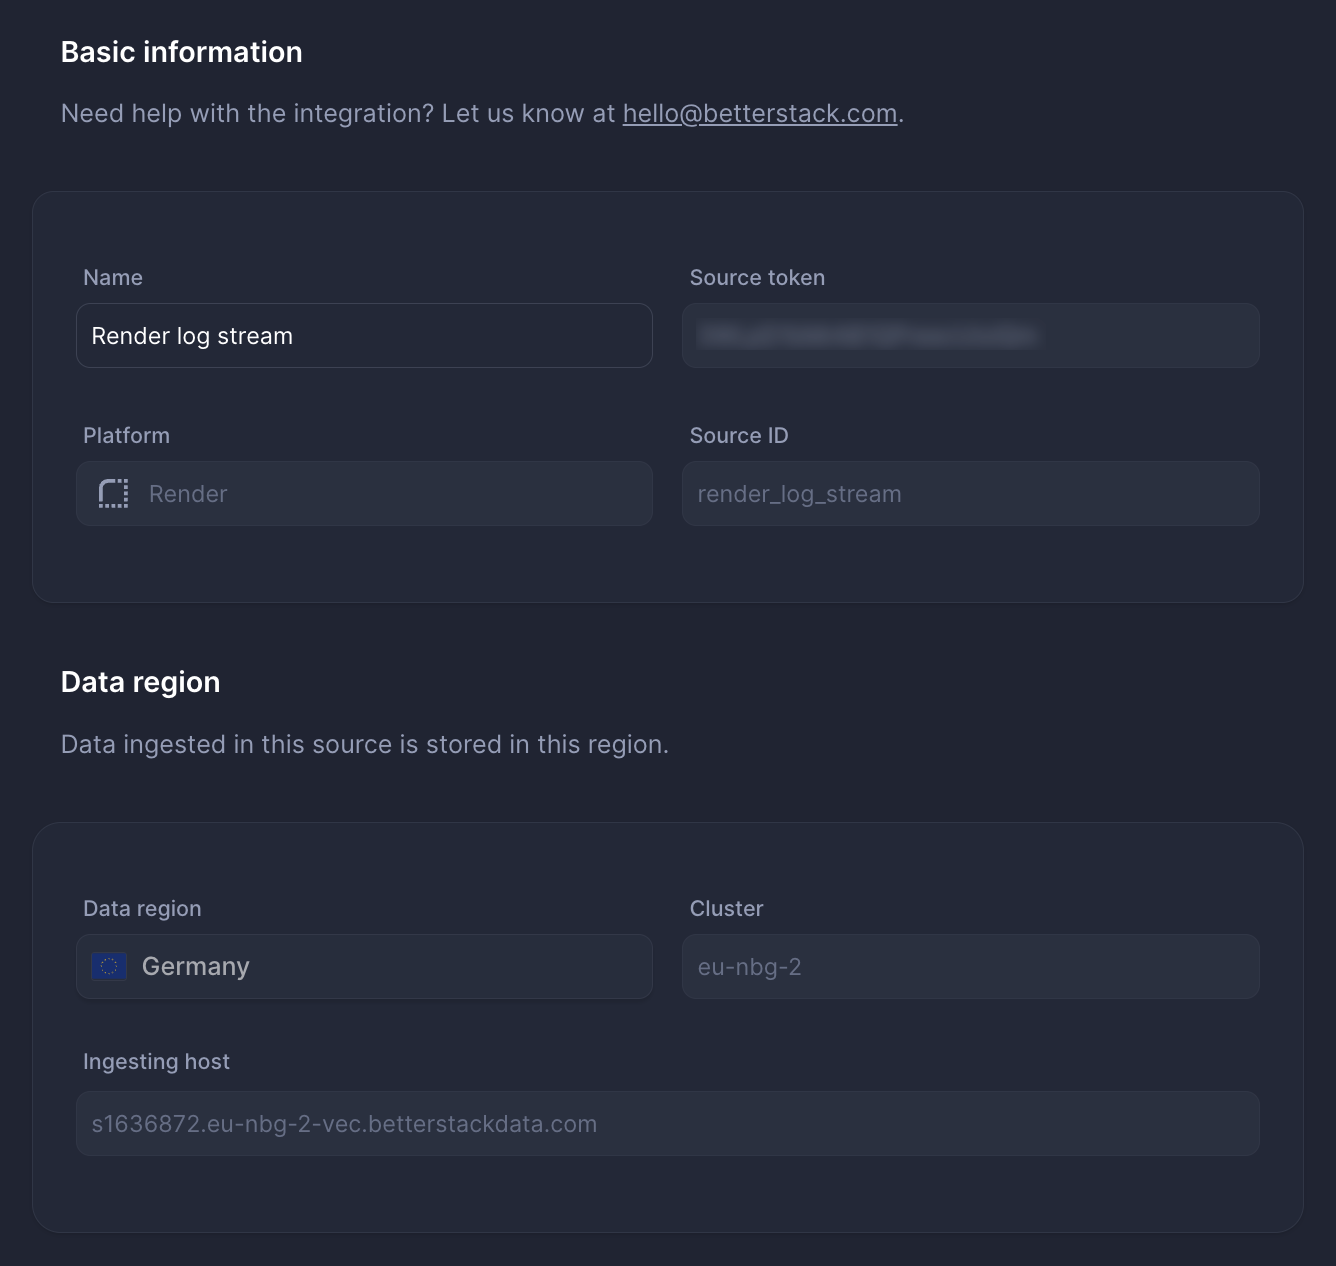
Click Connect source. Better Stack opens the details page for your new source:
-
Copy your source's Ingesting host URL.
Provide this value as your log stream's Log Endpoint in the Render Dashboard, and append the port
6514to the end. For example: -
Copy your source's Source token.
Provide this value as your log stream's Token in the Render Dashboard.
-
In the Render Dashboard, click Add Log Stream.


After you save your changes, Render logs start to appear in the Logs & traces tab of your Better Stack dashboard within a few minutes:

For more information, see the Better Stack documentation.
Datadog
Use HTTPS to stream logs to Datadog.
Datadog has deprecated TCP log forwarding. If you previously configured a syslog endpoint (such as intake.logs.datadoghq.com:10516), replace it with the appropriate HTTPS endpoint for your Datadog site.
Follow the instructions to stream logs to Datadog.
LaunchDarkly (previously highlight.io)
To stream logs to your existing LaunchDarkly project:
- Provide
syslog.observability.app.launchdarkly.com:34302as the Log Endpoint. - Provide your LaunchDarkly client-side ID as the Token.
For more information, including where to find your client-side ID, see the LaunchDarkly documentation.
Loggly
To stream logs to your Loggly account over HTTPS:
- Log in to your Loggly account and navigate to Source Setup > Customer Tokens.
- Copy your existing token or create a new one.
- In the Render Dashboard, provide the following:
- Log Endpoint:
https://logs-01.loggly.com:443 - Token: Your Loggly customer token.
- Log Endpoint:
Render delivers each log line to Loggly as a JSON object. If your service has JSON logs, those fields are included directly, for example:
For more information, see the Loggly documentation.
Mezmo (previously LogDNA)
Log in to your Mezmo account and navigate to the sources page. Select syslog on the left sidebar to see your syslog endpoint.

New Relic
To stream logs to your New Relic account:
- Provide the New Relic syslog endpoint for your account's region as the Log Endpoint:
- US:
newrelic.syslog.nr-data.net:6514 - EU:
newrelic.syslog.eu.nr-data.net:6514
- US:
- Provide your New Relic license key as the Token.
For more information, see the New Relic documentation.
Papertrail
Log in to your account and navigate to the setup page to find your Syslog endpoint:

If you use the same Papertrail account to collect logs from multiple providers, you can optionally generate a unique endpoint for your Render services.
SolarWinds
Follow the instructions for sending logs using syslog.
- Set the Log Endpoint to your organization's syslog collector endpoint. This endpoint has the format
syslog.collector.xx-yy.cloud.solarwinds.com:6514, wherexx-yyrepresents the data center your organization uses. See Data centers and endpoint URIs to find the exact URL. - Provide your API ingestion token as the Token.
- Your API ingestion token is found in the Token field.
Sumo Logic
Follow the instructions for configuring a cloud syslog source.
After you configure your source, Sumo Logic displays a modal with a Token and Host. Use these for your log stream's Token and Log Endpoint, respectively.